In 2021, most organisations are interested in leveraging social media insights to power their marketing efforts. However, in practice, many brand marketers find it difficult to discover the ‘truths’ they need among the billions of social media data points created every day.
As we lose inferred identifiers (such as Cookies, Maids, etc.) from the digital marketing ecosystem, other sources of reliable, large-scale behavioural data will become more valuable to marketers. At Fifty, we believe social media data provides the largest organic consumer research panel available anywhere. Our unique technology harvests insights from this data to help brands better understand their current and target audiences and improve the effectiveness of their media planning.
Fifty’s social analysis is also hugely effective when it comes to creating ID-free audiences. We use the behavioural footprint of any ‘tribe’ to create and filter a map of where this particular audience can be found online.
Our entire dataset is drawn from public domain social platforms, meaning it is both live and constantly updated. The data is completely unstructured when gathered, unled by questionnaires or the restrictions of focus groups, providing marketers with the ability to read the live pulse of their audience on a daily basis.
At its heart, our business involves processing and aggregating truly enormous volumes of data (380m+ social accounts). This data remains highly complex in both breadth and variation. In most platform datasets with this level of sophistication, analysis remains the domain of data scientists, rather than being led by marketers or business leaders; which is a problem.
Given the increasing relevance of social data to the targeting and activation of marketers campaigns, surely the analysis of social data should be more accessible to a greater range of decision-makers?
Complex analysis, simple outcomes
Data alone is not a substitute for strategy. Fifty has worked over the last five years to develop an intuitive and accessible user interface that allows everyone to interpret social insights and delve deeper into what makes their consumers tick. Our platform turns billions of disparate data points into vibrant and easy to understand visualisations that dynamically lay out the interests and behaviours of your target audience.
We then activate these bespoke data segments, pushing tailored creative across channels to deliver the right message, to the right audience, at the right time.
Here is an example of one of the network visualisations from the Fifty platform:
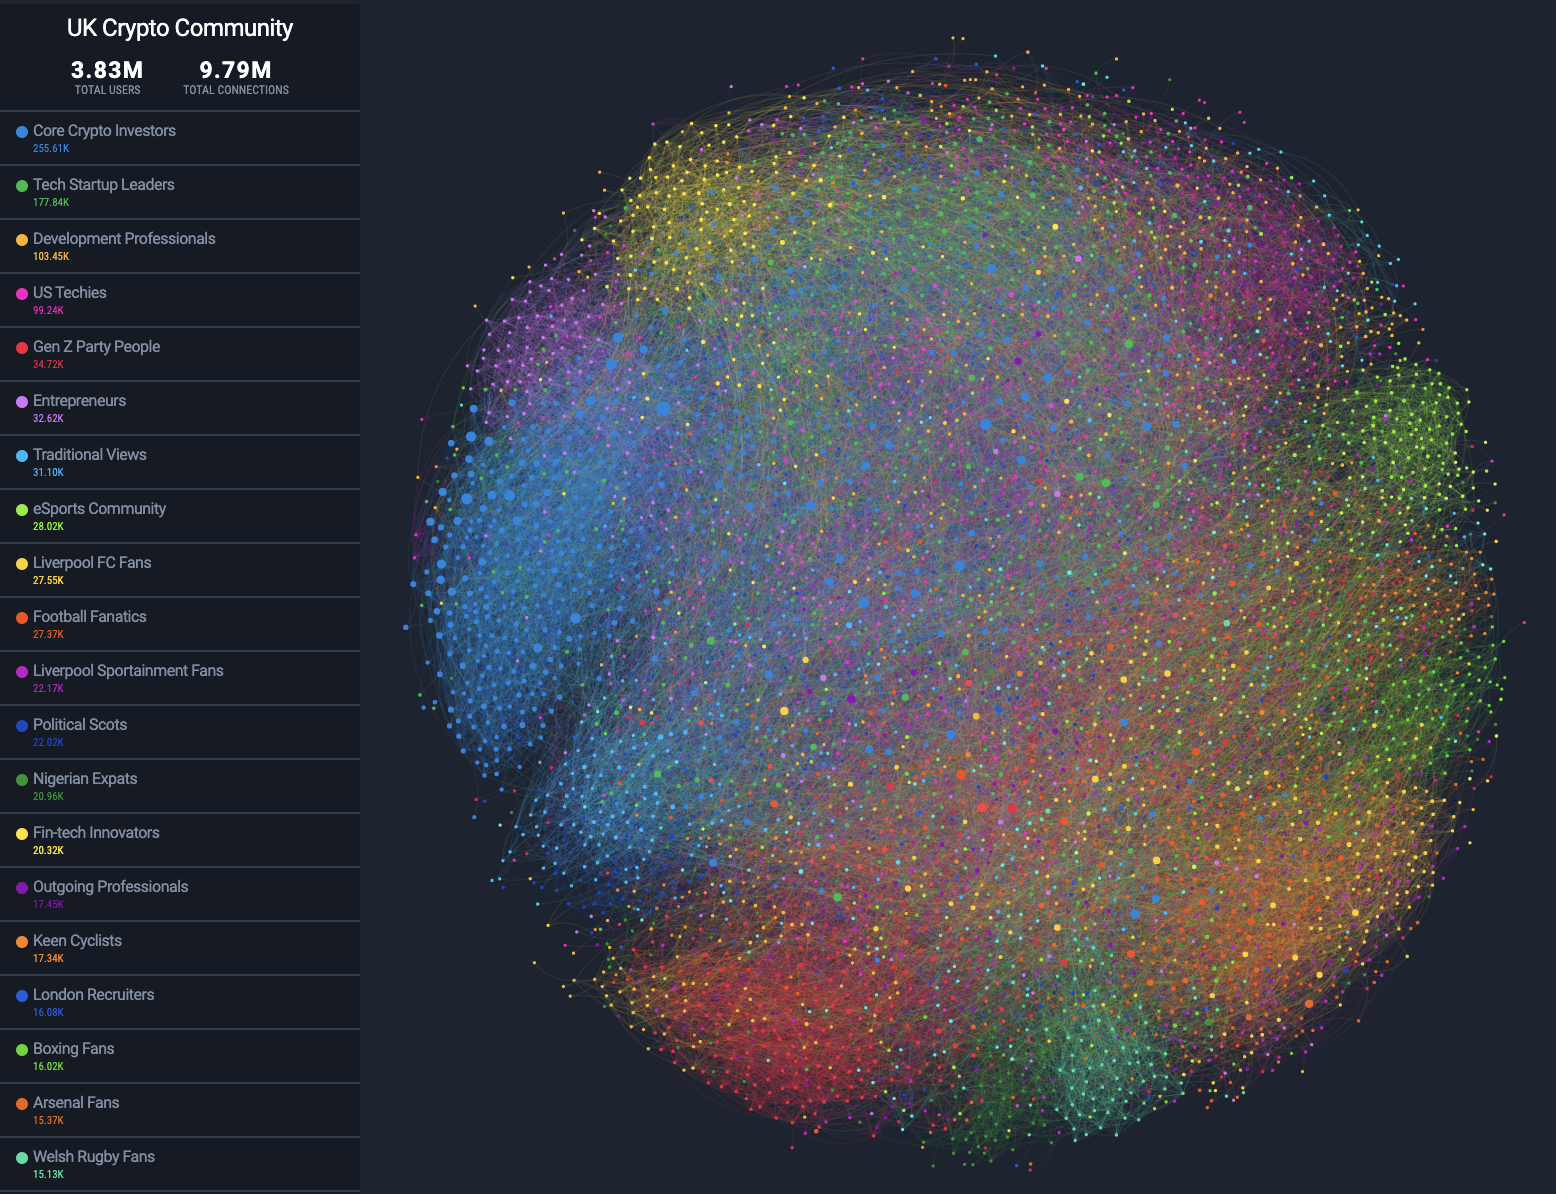
You can see here that the UK Cryptocurrency Community consists of 3.83 million users that fall into a range of sub-groups; primarily Core Crypto Investors, Tech Startup Leaders and Development Professionals, as well as some unexpected groups of Gen Z Party People and Football Fanatics.
No other research tool enables such connected real-time optimisation of campaigns directly from such rich audience data. Most other contextual systems rely primarily on keywords and often target huge volumes of low quality inventory that’s of little or no interest to your target audience, leading to wasted spending.
Fifty’s unique visualisations make it easy to understand who your target audience is, what they care about and where to find them online right now. Want to see the Fifty platform for yourself? Book a demo.